
Most commercial and industrial finance teams check one number on the commercial electricity bill: the total. It gets paid, and the detail behind it goes unread. That is where money leaks. A C&I electricity bill is made up of several distinct charges, each driven by a different behaviour, and each with its own opportunity to reduce. Here is how to read it.
The energy charge
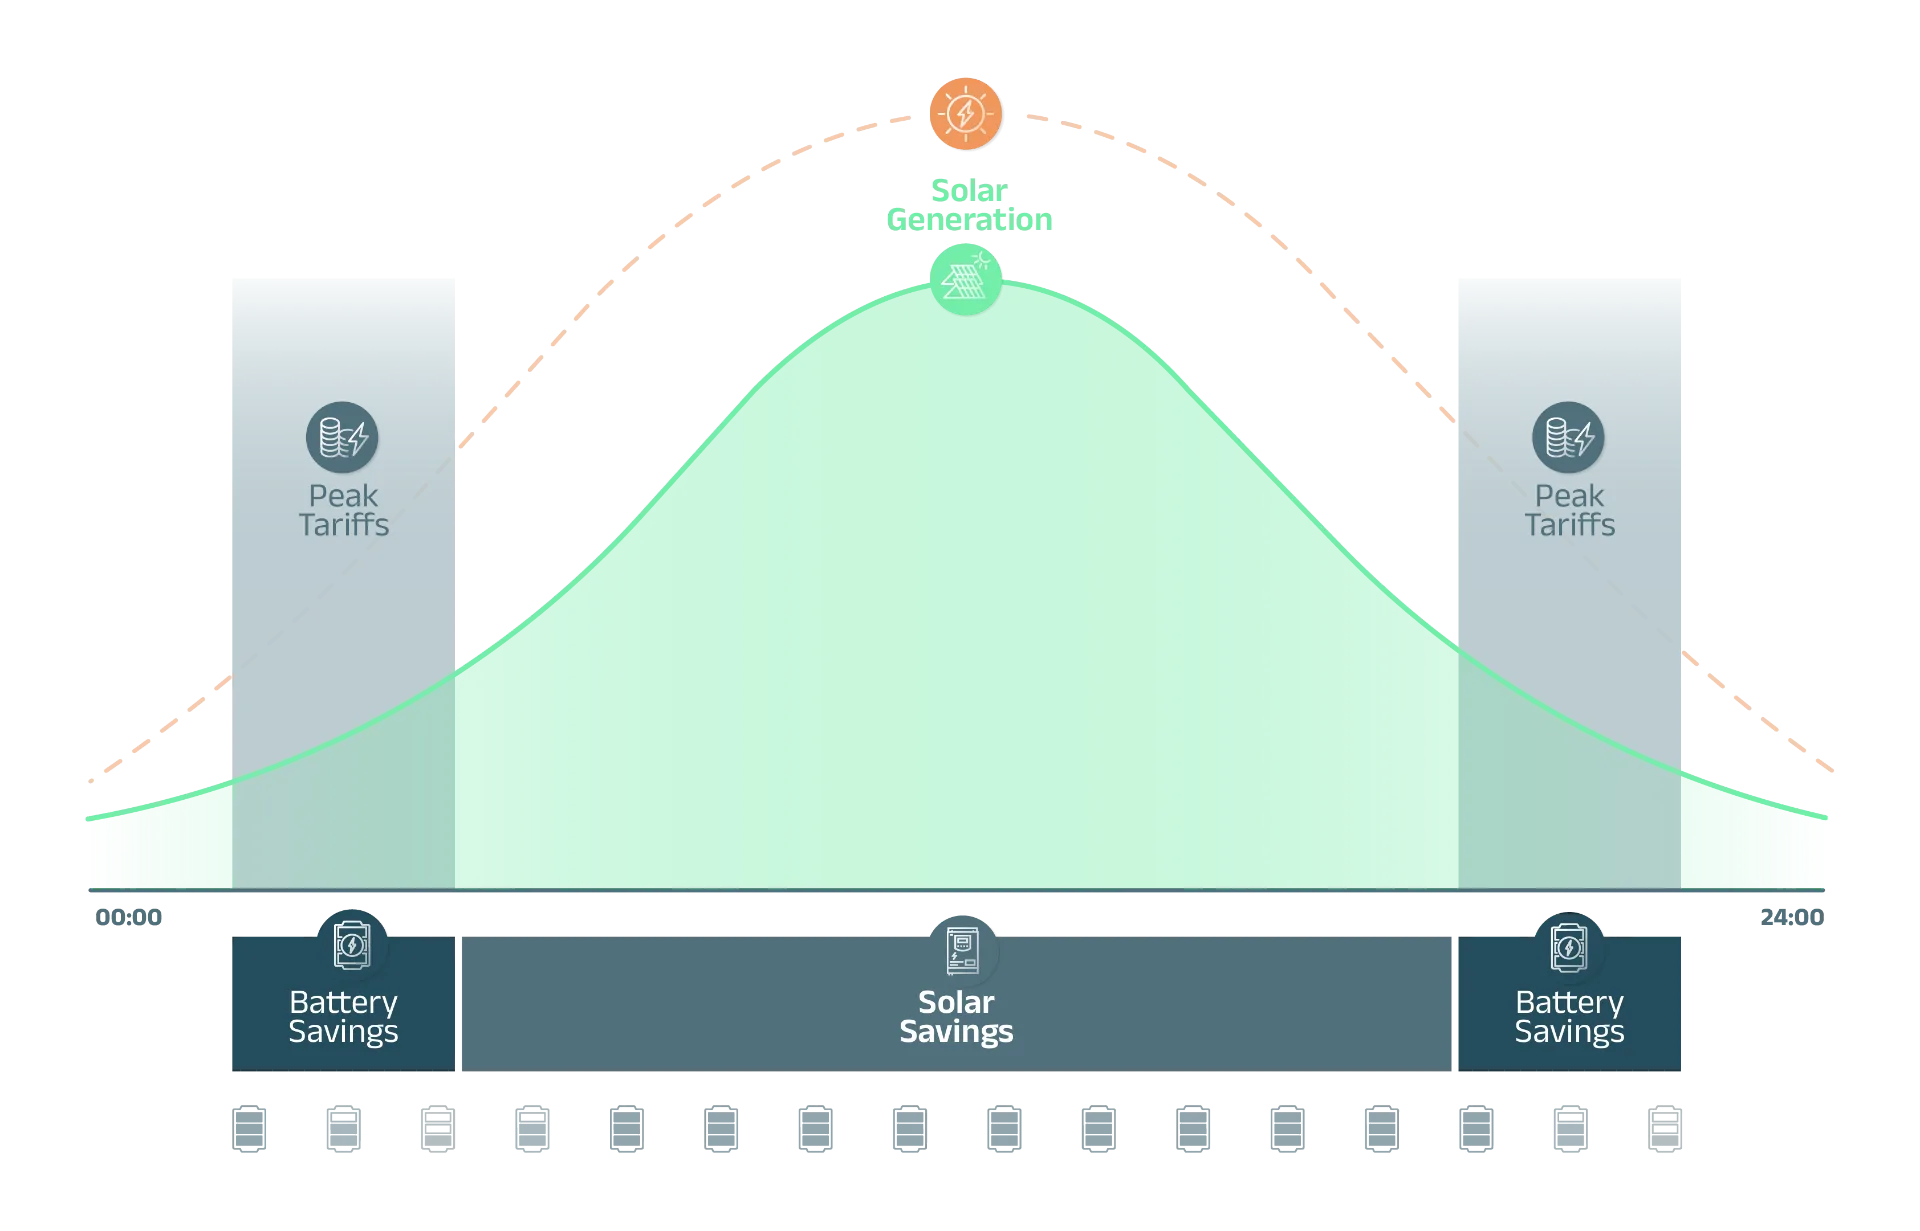
This is the part most people expect: rand per kWh for the electricity you consume. On a Time-of-Use (TOU) tariff such as Eskom Miniflex or a municipal equivalent, this rate changes by time of day. Peak periods cost several times more than off-peak, and there is a seasonal difference too, with winter months carrying the highest peak rates.
Look for how much of your consumption falls in peak versus off-peak. If a large share sits in peak, you are paying a premium that solar and energy arbitrage are built to reduce.
The demand charge
This is the line most sites overpay on without realising it. The demand charge is billed in kVA, based on the single highest power spike your site drew in any half-hour of the month. It has nothing to do with total consumption and everything to do with your sharpest peak. One simultaneous start-up of large equipment can set the charge for the entire month.
Find the kVA figure and the rand amount attached to it, then work out what share of your total bill it represents. On many C&I sites, it is surprisingly large, and it responds directly to battery peak shaving.
Network, capacity, and service charges
These are the fixed and semi-fixed lines: network capacity, service and administration charges, and any ancillary levies. They are often tied to your Notified Maximum Demand (NMD), the capacity your connection is contracted for. If your NMD is set higher than you actually need, you may be paying for capacity you never use.
Power factor and reactive energy penalties
Many C&I bills include a reactive energy or power factor penalty. If your site runs a lot of motors and your power factor is poor, the utility charges you extra for the reactive load. This penalty is easy to miss and often correctable through engineering.
Where sites overpay most
Three patterns show up repeatedly:
- A high demand charge caused by uncontrolled peaks that peak shaving could flatten
- A high peak-period energy spend that solar and arbitrage could shift to cheaper hours
- Fixed charges or a power factor penalty tied to an oversized NMD or poor load management
What to do with your bill
Pull your most recent bill and note four numbers: your total, your peak-to-off-peak rate ratio, your kVA demand charge, and your NMD. Those four tell you quickly where your money is going and which solution, solar, battery arbitrage, or peak shaving, is likely to deliver the strongest return.
Forest Energy models all four directly from your metered data, so the business case reflects your actual bill rather than an assumption. If you do not have interval data yet, Forest Insights installs billing-grade metering that shows exactly where your exposure sits.